“可信度图”的版本间的差异
(创建页面,内容为“ PhoXi Scanners have the resolution of 3,2 Million points, which correspond to the resolution of the 2D sensor inside (2064x1544). For each pixel in the 2D sensor th…”) |
|||
| 第1行: | 第1行: | ||
| + | PhoXi扫描仪的分辨率为320万点,对应于内部2D传感器的分辨率(2064x1544)。对于2D传感器中的每个像素,都有一个计算出的3D点。每个像素的计算精度由“可信度”值估算,此值以毫米为单位来表现3D测量误差。请注意,这个值只是估计值。真正的值只能通过与黄金(CAD)模型的比较来获得。 | ||
| − | + | ==探索PhoXi控件中的可信度图== | |
| − | + | 打开左侧窗格中的“Output Structure”标签,勾选“ConfidenceMap”复选框并按“Set”按钮确认。新标签将会添加到查看器窗格中。现在触发扫描并将当前视图切换到ConfidenceMap。使用右窗格中的“Maximal Value”阈值并将其设置为较小值(例如1.00毫米)。现在每个像素的测量误差将会测绘为颜色:具有零误差的点将为黑色,具有1毫米以上误差的点将为白色,而具有0-1误差的点将呈现某些灰色阴影。 | |
| − | + | 将鼠标光标移到像素上方,可以在右侧窗格中看到实际的可信度值(测量的估计误差)。 | |
| − | + | [[File:Confidence-map-explanation 1080.jpg | border | 500px]] | |
| − | + | ==在PLY中保存可信度图== | |
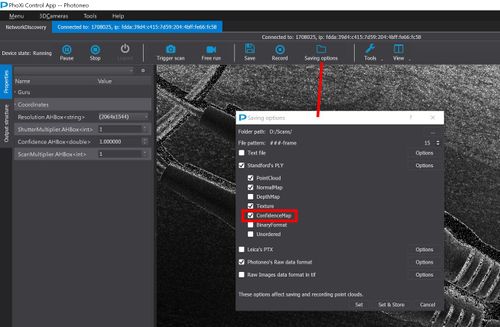
| − | + | 打开保存选项对话框,并在PLY选项中勾选“Confidence Map”。 | |
| − | |||
| − | |||
[[File:Saving-confidence-map.jpg|border|500px]] | [[File:Saving-confidence-map.jpg|border|500px]] | ||
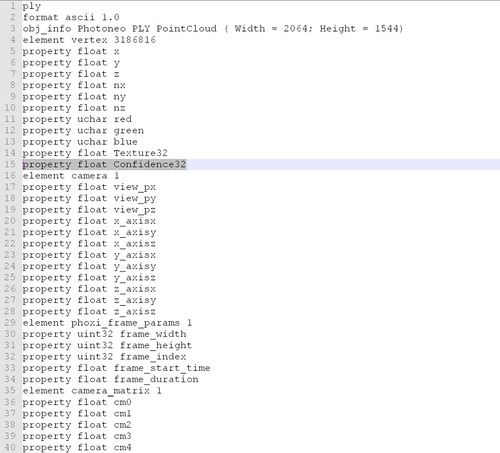
| − | + | 可信信度值将会添加到PLY结构中。 | |
[[File:Ply-header-with-confidence.jpg|border|500px]] | [[File:Ply-header-with-confidence.jpg|border|500px]] | ||
| − | + | 而每个点的信息也将包含可信度值。 | |
[[File:Ply-point-with-confidence.jpg|border|500px]] | [[File:Ply-point-with-confidence.jpg|border|500px]] | ||
| − | + | 说明: | |
| − | * | + | * 点的坐标[-49.9265 -3.09847 186.842] |
| − | * | + | * 点的法向量[0.359787 -0.00883223 -0.932993] |
| − | * | + | * 点的RGB颜色[15 15 15] |
| − | * | + | * 点的32位颜色[19] |
| − | * | + | * 可信度[0.0265961] - 这意味着获取该点的估计精度为0.0265961毫米 |
2018年4月6日 (五) 05:52的版本
PhoXi扫描仪的分辨率为320万点,对应于内部2D传感器的分辨率(2064x1544)。对于2D传感器中的每个像素,都有一个计算出的3D点。每个像素的计算精度由“可信度”值估算,此值以毫米为单位来表现3D测量误差。请注意,这个值只是估计值。真正的值只能通过与黄金(CAD)模型的比较来获得。
探索PhoXi控件中的可信度图
打开左侧窗格中的“Output Structure”标签,勾选“ConfidenceMap”复选框并按“Set”按钮确认。新标签将会添加到查看器窗格中。现在触发扫描并将当前视图切换到ConfidenceMap。使用右窗格中的“Maximal Value”阈值并将其设置为较小值(例如1.00毫米)。现在每个像素的测量误差将会测绘为颜色:具有零误差的点将为黑色,具有1毫米以上误差的点将为白色,而具有0-1误差的点将呈现某些灰色阴影。
将鼠标光标移到像素上方,可以在右侧窗格中看到实际的可信度值(测量的估计误差)。
在PLY中保存可信度图
打开保存选项对话框,并在PLY选项中勾选“Confidence Map”。
可信信度值将会添加到PLY结构中。
而每个点的信息也将包含可信度值。
说明:
- 点的坐标[-49.9265 -3.09847 186.842]
- 点的法向量[0.359787 -0.00883223 -0.932993]
- 点的RGB颜色[15 15 15]
- 点的32位颜色[19]
- 可信度[0.0265961] - 这意味着获取该点的估计精度为0.0265961毫米


